Environment
At Rituals, we work to reduce the negative impact we have on the environment. We focus on reducing our greenhouse gas (GHG) emissions, improving our packaging, and reducing the negative impact our ingredients have on nature.


Our refills save2.1million kilogram of material
Our carbon footprint
Climate change
Reducing our GHG emissions is an important part of progressing toward our broader sustainability goals. We developed Science-Based Targets (SBTs) to guide us in reducing our emissions. Our near-term and long-term emissions reduction targets are aligned with a 1.5°C pathway, as validated by the Science Based Targets Initiative (SBTi).
Our carbon footprint
Tracking our carbon emissions is a key part of understanding whether we are moving in the right direction against our climate targets. By strengthening our data and methods, we can better measure progress, identify where action is needed, and stay focused on meaningful emissions reduction over time.
Read more for 2025 emissions
Scope 1 & 2
Total in scope 1 & 2
2%
Scope 3
Purchased goods and services*
65%
Capital goods*
17%
Upstream transport and distribution
7%
Employee commuting
3%
*Purchased goods & services and Capital goods include spend-based data emissions
Read more |
Breakdown on emissions and year-on-year comparisons
Across Scopes 1, 2, and 3, value chain emissions (Scope 3) represent approximately 98% of our total market-based footprint, while Scope 1 and 2 emissions represent approximately 2%.
*Data for 2025 is subject to a limited assurance engagement under ISO 14064-3:2019 Greenhouse gases - Part 3: Specification. Refer to the Limited Assurance report from our auditor.
In 2025, we used spend-based estimates alongside supplier- and activity-based data. Spend-based calculations estimate emissions based on money spent, while activity-based calculations consider actual activities that occurred. Spend-based methods are consistent with GHG Protocol guidance and help reduce the risk of underreporting where primary data is unavailable. However, results may vary due to price changes and the emission factors applied, which means year-on-year movements do not always reflect underlying physical changes in emissions. Our aim is to continue improving data quality and increase the share of primary data over time.
As a result of our 2025 calculation methods, categories such as capital goods and purchased services, which are currently largely estimated using the spend-based method, represent a larger share of the reported footprint than in previous years. This reflects both expanded reporting coverage and the characteristics of the calculation method, rather than a definite like-for-like increase in physical emissions.
Excluding spend-based estimates, purchased goods remain the largest contributor to our emissions, mainly driven by ingredients and packaging materials. This reflects the material intensity of our products and the emissions associated with upstream production. Upstream transport and distribution (our supply chain transport), also remains a significant contributor, underlining the importance of ongoing work to improve logistics efficiency and support the use of lower-carbon fuels, where feasible.
337
Total emissions
in ktCO2e
Our climate targets and progress
NEAR-TERM TARGETS (2030)
42
%
GHG reduction on scope 1 & 2 by 2030
51.6
%
GHG reduction on scope 3 by 2030
READ MORE
Following the 2025 rebaseline and methodology updates, our reported Scope 1 and 2 emissions grew by 91% in 2025 compared to 2021. It is important to note that this result is largely driven methodological updates, improved energy data and assumptions used to extrapolate natural gas consumption. Our rapid growth has also increased our energy consumption, especially gas use, and changes in data quality have further influenced the figures. We are working to better separate data and methodology effects from decarbonization impacts while improving energy data quality.
Near-term targets
By 2030, we commit to reducing absolute Scope 1 and 2 GHG emissions by 42% from a 2021 base year. We also commit to reducing Scope 3 GHG emissions by 51.6% per EUR value added (euro gross profit) within the same timeframe.
Long-term targets (2050)
90
%
GHG reduction on scope 1 & 2 by 2050
97
%
GHG reduction on scope 3 by 2050
READ MORE
Following the 2025 rebaseline and methodology updates, our reported Scope 1 and 2 emissions grew by 91% in 2025 compared to 2021. It is important to note that this result is largely driven methodological updates, improved energy data and assumptions used to extrapolate natural gas consumption. Our rapid growth has also increased our energy consumption, especially gas use, and changes in data quality have further influenced the figures. We are working to better separate data and methodology effects from decarbonization impacts while improving energy data quality.
Long-term targets
By 2050, we commit to reducing absolute Scope 1 and 2 GHG emissions by 90% from a 2021 base year. We also commit to reducing Scope 3 GHG emissions by 97% per EUR value added within the same timeframe.
Progress toward our 2030 targets
Scope 1 & Scope 2 emissions progress (kton CO2e)
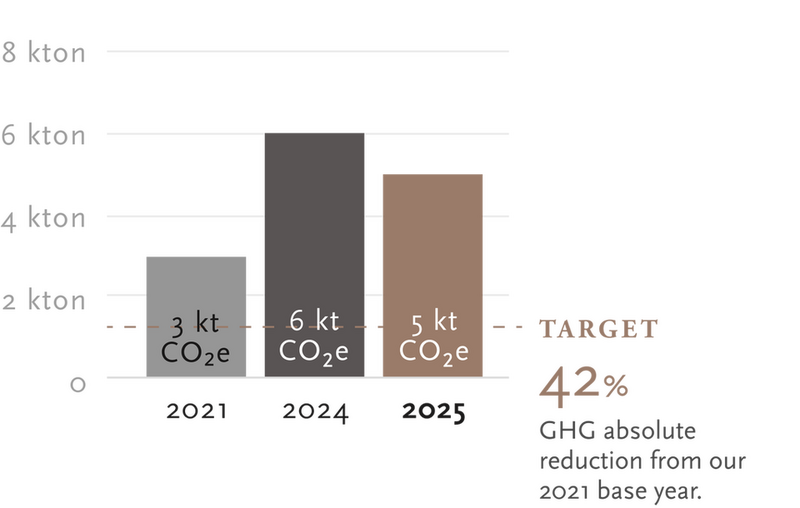
Following the 2025 rebaseline and methodology updates, our reported Scope 1 and 2 emissions grew by 91% in 2025 compared to 2021. It is important to note that this result is partially driven by methodological updates, improved energy data and assumptions used to extrapolate natural gas consumption. Our rapid growth has also increased our energy consumption, especially gas use, and changes in data quality have further influenced the figures. We are working to better separate data and methodology effects from decarbonization impacts while improving energy data quality.
Scope 3 emissions progress (kton CO2e and intensity)
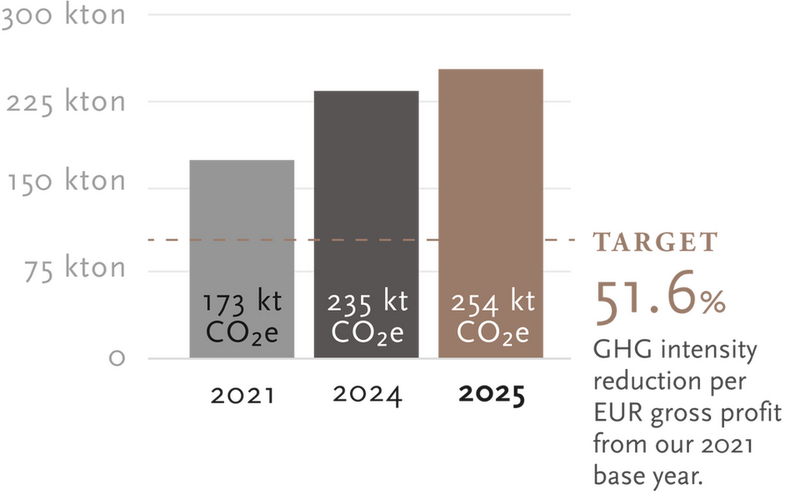
As of 2025, we report a -34% reduction in this intensity metric compared with our 2021 base year, representing progress toward our 2030 target. This demonstrates continued advancement, although further reductions will be needed over the coming years to deliver our target in full.
Our Scope 3 target is intensity-based, meaning we aim to reduce emissions per euro of gross profit over time. However, this means that as the business grows, absolute Scope 3 emissions could still increase, while meeting our intensity-based target. In parallel, we use additional internal KPIs to help track decarbonisation progress beyond changes linked to growth or profitability.
READ MORE
Because the scope 3 target is intensity-based, progress is influenced by both emissions' reduction actions and financial performance. In 2025, gross profit grew faster than Scope 3 emissions, improving the intensity result despite an increase in absolute Scope 3 emissions.
The increase in absolute Scope 3 emissions was primarily driven by our company's growth, which resulted in larger procurement volumes, a shift in certain products from PET to glass packaging, as well as increased product transportation
To complement this view, we also monitor emissions intensity per product as an internal indicator to help assess whether improvements are linked to operational and value chain decarbonisations beyond changes in profit. Internal assessments show that on a like-for-like product basis, improvements in our products, such as adding recycled packaging content, have led to lower product-level footprints.
Emissions reduction plan
We are continuing to develop our decarbonisation roadmap, which sets out the actions we expect may contribute to support progress towards our emissions reduction targets across Scopes 1, 2, and 3. As the roadmap continues to evolve, the most up-to-date overview our emissions reduction plan and our current priority actions is available in our Carbon Reduction Plan.
We intend to review and update the roadmap periodically to reflect developments in planning, implementation progress, data quality and coverage, and our understanding of emissions reduction opportunities.


Reduce, recycle and refill
Packaging
Packaging plays a significant role in our overall environmental impact, which is why we continuously explore opportunities to improve our packaging designs while maintaining the quality, safety, and performance of our products.


ⓘ
Reduce
We seek ways to reduce the weight and volume of our packaging designs, while ensuring that we deliver quality products.
Read more
New double the size Classic Refill Fragrance Sticks
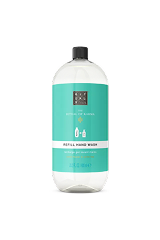
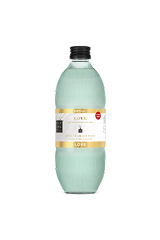
Lightweight Hand Wash Refill 600ml bottle

Reduction in bottle weight new shampoo products

Recycle
We are committed to improving our products by designing packaging that supports longevity, recyclability, and the use of recycled materials. By progressing towards our 2030 packaging goals, we aim to reduce reliance on virgin materials and increase the recyclability of our products.
Read more
Recyclability

We focus on designing our products for recyclability, making sure our packaging is designed to meet applicable recyclability criteria, where collection and recycling infrastructure exits. Our aim is to make sure our packaging portfolio meets the recyclability criteria by 2030 as set by the PPWR requirements.
Read more

Shampoo Bottle Change
We changed our cap to a silicone-free flip top mono PP cap on the new bottle design.

Classic Giftsets
Extending our paper moulded inlays instead of plastic PET inlays in our Small Classic Gift Sets.

Shampoo Refill Pouches
We introduced refill packaging which is mono material (polyolefins)— this means it may be recyclable where appropriate collection infrastructure exists.
During 2025, we undertook various projects aimed at improving the recyclability of our portfolio. For example:
- Shampoo Bottle Change: We changed our cap to a silicone-free flip top mono PP cap on the new bottle design.
- Classic Giftsets: Extending our paper moulded inlays instead of plastic PET inlays in our Small Classic Gift Sets.
- Shampoo Refill Pouches: We introduced refill packaging which is mono material (polyolefins)— this means it may be recyclable where appropriate collection infrastructure exists.
The definition of recyclability has evolved significantly in recent years as regulatory requirements and assessment methodologies have matured. For our current assessment, we apply the definition set out in the Packaging and Packaging Waste Regulation (PPWR), which provides a more stringent approach when evaluating packaging design for recyclability through guidelines of Verpact and RecyClass.
We are working to improve both the recyclability of our packaging portfolio and the quality and completeness of the underlying data. To support this, we are implementing a recyclability assessment tool that incorporates country-specific infrastructure characteristics and regulatory requirements. This will improve the quality and coverage of our data and enable a more accurate assessment of recyclability across the portfolio.
While an initial assessment has been performed, we are continuing to enhance our understanding of portfolio recyclability through improvements in data quality, portfolio coverage and assessment methodology. The implementation of the new assessment tool will further strengthen the accuracy and consistency of our recyclability assessment, providing a more robust foundation for performance tracking.
We will therefore use 2026 to further strengthen our methodology, data and assessment capabilities. From 2027 onwards, we intend to disclose a recyclability baseline and report progress against our recyclability target using the enhanced assessment approach.
As this is the first year of our recyclability target, we have established a Recyclability Implementation Plan plan setting out the actions expected to improve the recyclability of our packaging portfolio. The plan will be reviewed periodically to reflect implementation progress, improvements in data quality, regulatory developments and our evolving understanding of the most effective opportunities to increase recyclability.
Recycled Content
Aside from recyclability, we also focus on increasing the percentage recycled content (PCR) in our product packaging. Our objective is to ensure that our product packaging complies with the minimum recycled content requirements defined by the PPWR by 2030. For all products in our consumer facing portfolio that contain the material components listed below, we aim to meet the following material-specific recycled content targets:
- at least 95% recycled content for ferrous and non-ferrous metals (aluminium and steel),
- at least 65% recycled content for opaque polyethylene terephthalate (PET),
- at least 90% recycled content for transparent polyethylene terephthalate (PET),
- at least 35% for polypropylene (PP) and polyethylene (PE) Rigids & Flexibles.
Read more
In 2025, our baseline values for our targets are as follows:
Material Category | Baseline Value |
(Non)-ferrous materials (Aluminium & Steel) | 68% |
Opaque PET | 49% |
Transparent PET | 68% |
PP and PE Rigids & Flexibles | 6% |
Our baseline values reflect the recycled content currently identified across our main packaging material categories and provide a first reference point for tracking progress against our PPWR-aligned targets. Performance varies by material, with higher recycled content already present in aluminium, steel and PET packaging, while PP and PE rigid and flexible formats remain an important area for further improvement.
We will continue to improve the quality and completeness of the underlying data as we increase recycled content across the portfolio. As our data matures, we expect to strengthen the robustness of our baseline and improve the accuracy of progress tracking.
Below are some examples of products with recycled content materials in 2025.
Material | Product example | % |
Glass | Classic Home Parfum Refill | 100% |
Rigid Plastic (PP) | Shampoo Bottle | 50% |
Rigid Plastic (PET) | Advent Calendar Inlays | 90% |
Rigid Plastic (PET) | Hand Soap Concentrated Refill | 90% |
Aluminium & Steel | Shower Gel | 95% |
To support delivery of our PCR targets, we have developed an Recycled Content Implementation Plan outlining the actions that are expected to contribute to achieving these targets. We intend to review and update the plan periodically to incorporate developments in planning, implementation progress, data quality and coverage, and our evolving understanding of emissions reduction opportunities.
Refill
Our refill systems are another key pillar of our circularity strategy. We aim to offer refill options where they make commercial and impactful sense, allowing customers to reuse their original containers and reduce waste, giving a second life to consciously designed packaging.
Read more
Total Impact Savings 2025

CO2-eq
5,139,392
kg CO2-eq

Materials
2,179,600
kg

Energy
103,012,464
MJ-eq

Water
290,187,792
Liter
Nature
Biodiversity, water & pollution
We recognise that sourcing natural origin ingredients sourcing comes with nature-related risks. Much of our environmental impact occurs at the point of sourcing materials but we also acknowledge that our ingredients can continue to impact nature after long after they have been used.
We conduct a nature-based risk assessment for our ingredients to understand our impact on biodiversity and water. As a result, we have identified that these are our priority commodities related to nature risks: palm (kernel), oil soy, coconut, shea, cotton, cacao, sugar cane, sunflower oil, rapeseed oil and castor oil. For palm oil, we have set compliance standards for our products to mitigate nature-risks, while we are still developing our approach for the other commodities. In 2026, we plan to scope the targets for our priority commodities, identify credible and feasible certifications to pursue, set up data collection and reporting mechanisms to support traceability to sub-national origin and start engaging with our suppliers. We aim to have a first baseline for traceability and certification in 2026.
Resources saved with Rituals refill collection.
Savings | Classic collection fragrance sticks2) | Private collection fragrance sticks2) | Body cream1) | Day/night cream1) | Serum 1) | Hand wash (Full Size Refill)2) |
CO2 -eq | 45% | 46% | 41% | 45% | 42% | 64% |
Materials | 40% | 39% | 45% | 43% | 36% | 65% |
Energy | 48% | 52% | 41% | 39% | 41% | 63% |
Water | 53% | 47% | 39% | 29% | 37% | 65% |
Savings | Hand wash (Concentrate) | Shave cream1) | Men’s care1) | Shampoo1) | Scented candle Classic1) | Scented candle Private1) | Scented candle Soulful1) |
CO2 -eq | 42% | 38% | 39% | 38% | 35% | 36% | 42% |
Materials | 33% | 35% | 39% | 32% | 43% | 44% | 44% |
Energy | 35% | 28% | 34% | 27% | 27% | 32% | 39% |
Water | 32% | 24% | 38% | 33% | 33% | 34% | 46% |
Savings | Home perfume spray (400ML)1) | Home perfume spray (200ML)2) | Moisturizer1) | Car Air Refreshner1) | Car Parfum 1) |
CO2 -eq | 41% | 58% | 43% | 21% | 34% |
Materials | 40% | 60% | 36% | 28% | 37% |
Energy | 37% | 53% | 41% | 25% | 41% |
Water | 29% | 46% | 36% | 21% | 30% |
- Based on topping up your original product with a refill compared to buying a new original product. This is external verified research conducted by The LCA Center.
- Based on topping up your original product with a refill compared to buying two new original products. This is external verified research conducted by The LCA Center.
Accumulated numbers for the overview page
Total Impact Savings 2025 | ||
CO2 -eq | 5,139,392 | kg CO2-eq |
Energy | 103,012,464 | MJ-eq |
Water | 290,187,792 | litre |
Materials | 2,179,600 | kg |
In 2025 choosing our refillable products compared to the original corresponding products resulted in estimated savings of approximately: 103.3 million MJ-eq of energy, 290.2 million litres of water, 5.1 million kg of CO₂ equivalent, and 2.1 million kg of materials—based on life cycle assessments (LCAs) conducted across specific product categories.
Total Impact Savings: 2017 - 2025 | ||
CO2 -eq | 16,638,113 | kg CO2-eq |
Energy | 313,429,606 | MJ-eq |
Water | 412,299,423 | liter |
Materials | 6,522,853 | kg |
Since 2017, choosing our refillable products compared to the original corresponding products has resulted in estimated savings of approximately: 313.4 million MJ-eq of energy, 412.3 million litres of water, 16.6 million kg of CO₂ equivalent, and 6.5 million kg of materials—based on life cycle assessments (LCAs) conducted across specific product categories.
Palm-derived ingredients
99.9% of the palm oil and palm kernel oil-derived ingredients used in Rituals' products in 2025 were from RSPO-certified sources.

Microbeads and Microplastics
Since 2022, our formulations have been 100% microbead-free. Since then, we have been working hard to review and reduce the use of microplastics in our products in line with regulatory definition.
Biodegradability
In addition to our work on microplastics, we aim to improve the overall biodegradability of our rinse-off formulas. To do so, we set a biodegradability target in 2025: By 2035, 95% of our rinse-off formulas will be 95% biodegradable.

Employees
Read more
Details on Climate Footprint
As part of the ongoing development of our GHG reporting, we continue to strengthen our emissions data collection and review processes. In 2025, we implemented two significant changes to our GHG inventory process.
First, we digitised our carbon footprint data management through the implementation a sustainability data management platform used to calculate and consolidate our emissions. This supports more structured data capturing, stronger controls, and clearer audit trails, and reduces reliance on manual spreadsheets.
Second, we completed a rebaseline of our GHG calculation methodology to reflect improved data availability. This enabled us to use more representative assumptions and a more consistent calculation approach. The update was applied to our 2021, 2024, and 2025 data.
As a result of these changes, figures disclosed in earlier sustainability reports for 2021 and 2024 have been replaced by the updated inventory presented in this report. We did not recalculate 2022 and 2023 data at this stage, as we prioritised the baseline year, prior year, and current reporting year. This means that data from 2022 and 2023 from previous reports is not fully comparable with the updated figures.
In addition, our 2025 GHG emissions were subject to an external audit. In previous years, we obtained third-party verification focused primarily on methodological alignment with the GHG Protocol. The 2025 process involved a limited assurance where a more detailed review was done over the reported figures and underlying process. The recalculated figures for 2021 (the updated baseline) and 2024 were not externally verified in the 2025 reporting cycle.
Rituals emissions (kt CO2e) | Base year 2021 | FY 2024 | FY 2025* | % 2025 vs 2024 | % 2025 vs 2021 |
Scope 1 | 2 | 4 | 4 | -2% | 81% |
Direct GHG emissions from stationary combustion | 1 | 2 | 3 | 81% | 419% |
Direct GHG emissions from mobile combustion | 2 | 2 | 1 | -57% | -43% |
Direct fugitive GHG emissions | 0 | 0 | 0 | -65% | 418% |
Scope 2 (market-based) | 0 | 2 | 1 | -29% | 139% |
Indirect GHG emissions from imported electricity (location-based) | 4 | 7 | 7 | 5% | 85% |
Indirect GHG emissions from imported electricity (market-based) | 0 | 1 | 0 | -100% | -100% |
Indirect GHG emissions from imported energy other than electricity | 0 | 1 | 1 | 39% | 263% |
Scope 3 | 203 | 289 | 332 | 15% | 63% |
Purchased goods and services | 133 | 173 | 182 | 5% | 37% |
Capital goods | 22 | 44 | 58 | 32% | 161% |
Fuel and energy related activities not included in Scope 1 or 2 | 3 | 6 | 8 | 29% | 195% |
Upstream transport and distribution | 12 | 19 | 25 | 33% | 111% |
Waste generated in operations | 3 | 3 | 4 | 54% | 41% |
Business travel | 0 | 2 | 2 | -19% | 311% |
Employee commuting | 8 | 9 | 11 | 14% | 37% |
Use of sold products | 4 | 8 | 5 | -37% | 27% |
End-of-life treatment of sold products | 18 | 25 | 37 | 47% | 98% |
Franchises | 0 | 1 | 1 | 34% | 100% |
Total GHG emissions | |||||
Location-based emissions | 210 | 301 | 344 | 14% | 64% |
Market-based emissions | 206 | 295 | 337 | 14% | 64% |
Total emissions in scope of targets* | 173 | 235 | 259 | 10% | 50% |
*SBTi target scope: Market-based emissions excluding spend-based data, spend-based data is used in the category purchased goods and services for services, and in capital goods for goods such as furniture in store where no activity data is available
Reduce
Lorem ipsum dolor sit amet, consectetur adipiscing elit. Phasellus ornare fermentum velit id imperdiet. Nullam ac dolor ac elit efficitur elementum.
Morbi gravida metus eget odio dignissim, in aliquet nisi pulvinar. Donec imperdiet leo ac volutpat elementum. Vivamus aliquam vestibulum nisi nec lobortis. Nullam semper sapien sapien, tristique fermentum dolor auctor vel. Curabitur fringilla nunc nec leo vehicula mollis.
Fusce molestie condimentum massa, vitae tincidunt justo. Maecenas ut lacus egestas metus euismod laoreet eu et nisl. Integer blandit augue magna, vel luctus ex ornare at.
Cras sit amet libero vitae velit scelerisque tincidunt blandit congue ligula. Donec eget ex facilisis lacus suscipit malesuada vel eu urna. Nullam elementum accumsan mauris ut laoreet. Aenean ac imperdiet ipsum, sed pulvinar elit.
Overview of packaging
with recycled content
| Packaging made of 95% RPET | To be transitioned | |
|---|---|---|
| Bath Crystal | Hand Gel | The Ritual of Sakura |
| Bath Foam | Hair & Body Mist Travel | Laundry Collection |
| Body Cream | Home Spray | White Body Cream Jar |
| Body Lotion | Kitchen Hand Balm | White Body Lotion Bottle |
| Body Mask | Kitchen Hand Wash | White Body Scrub Jar |
| Bath Oil | Kitchen Hand Wash Refill | |
| Body Scrub | Milky Bath | |
| Cleansing Foam | Shower Oil | |
| Dish Wash | ||
Refill savings
per product overview
Resources saved with Rituals refill collection.*
Classic collection fragrance sticks 2)
CO2-eq
45%
Materials
40%
Energy
48%
Water
53%
Private collection fragrance sticks 2)
CO2-eq
46%
Materials
39%
Energy
52%
Water
47%

Body cream
CO2-eq
41%
Materials
54%
Energy
41%
Water
39%

Day/night cream
CO2-eq
45%
Materials
43%
Energy
39%
Water
29%

Serum
CO2-eq
42%
Materials
36%
Energy
41%
Water
37%

Hand wash (Full Size Refill)
CO2-eq
64%
Materials
65%
Energy
63%
Water
65%
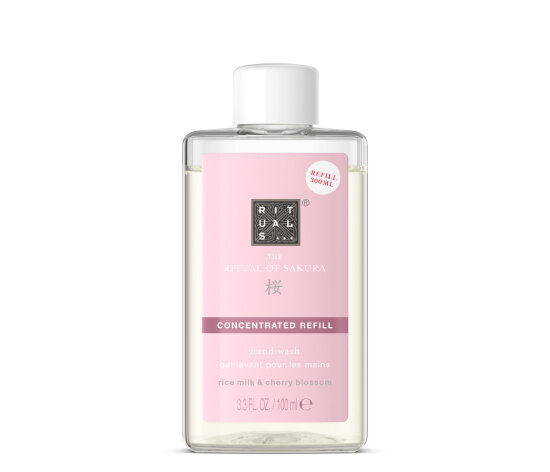
Hand wash concentrate
CO2-eq
42%
Materials
33%
Energy
35%
Water
32%

Shave cream
CO2-eq
38%
Materials
35%
Energy
28%
Water
24%

Men's care
CO2-eq
39%
Materials
39%
Energy
34%
Water
38%

Shampoo
CO2-eq
38%
Materials
32%
Energy
27%
Water
33%

Scented candle Classic 1)
CO2-eq
35%
Materials
43%
Energy
27%
Water
33%

Scented candle Private 1)
CO2-eq
36%
Materials
44%
Energy
32%
Water
33%

Scented candle SOULFUL 1)
CO2-eq
42%
Materials
44%
Energy
39%
Water
46%

Home perfume spray (400ML) 1)
CO2-eq
41%
Materials
40%
Energy
37%
Water
29%

Home perfume spray (200ML) 2)
CO2-eq
58%
Materials
60%
Energy
53%
Water
46%

Moisturizer 1)
CO2-eq
43%
Materials
36%
Energy
41%
Water
36%
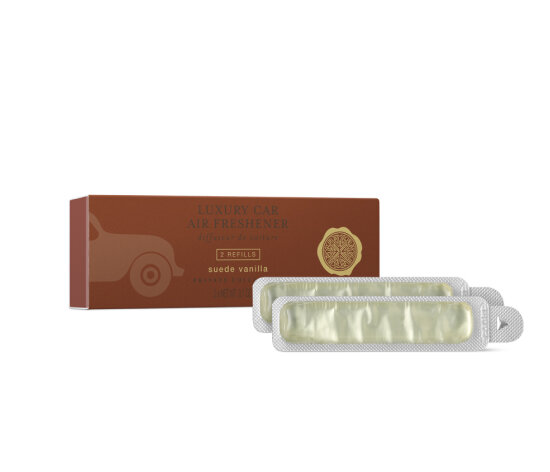
CAR Air freshener
CO2-eq
21%
Materials
28%
Energy
25%
Water
21%

Car perfume
CO2-eq
34%
Materials
37%
Energy
41%
Water
30%
- Based on topping up your original product with a refill compared to buying a new original product. This is external verified research conducted by The LCA Center.
- Based on topping up your original product with a refill compared to buying two new original products. This is external verified research conducted by The LCA Center.
Palm-derived ingredients
Rituals is a member of the Roundtable on Sustainable Palm Oil (RSPO), a non-profit organisation that unites stakeholders from the palm oil industry to develop and implement global standards for sustainable palm oil. As a stakeholder in the palm oil supply chain, we support the initiatives of the RSPO, which work to mitigate the negative impacts of palm oil production on the environment, wildlife, and local communities. Additionally, we engage with suppliers to transition to 100% certified sustainable palm oil sources (RSPO-certified).
As a result, 99.9% (vs. 99.8% in 2024) of the palm oil and palm kernel oil-derived ingredients used in Rituals' products in 2025 were from RSPO-certified sources in 2025. This is based on data covering 99.8% of our total ingredient procurement volume for the year.
This represents important progress; however, RSPO certification does not necessarily eliminate all environmental or human rights risks associated with palm oil production. As such, we continue to support the RSPO in its ongoing efforts to drive progress in sustainable palm oil production.
Microbeads and Microplastics
Microbeads and microplastics from cosmetic products are known to contribute to water pollution. Due to the scientifically proven environmental concerns associated with the accumulation of microplastics in our oceans, we do not use microbeads in any of our products. Instead, we use natural alternatives such as sea salt, sugar, pumice (volcanic rock), and bamboo.
We closely monitor developments in regulatory requirements, and we are in the process of assessing all collections to ensure they remain in line with the REACH restriction on Microplastics recently adopted by the European Commission*.
*Regulation 2023/20555 amendment to Regulation (EC) No 1907/2006 of the European Parliament and of the Council concerning the Registration, Evaluation, Authorisation, and Restriction of Chemicals (REACH)
Biodegradability
We assess all ingredients used in our rinse off formulas and remove non-biodegradable ingredients where readily biodegradable alternatives of the same quality and performance are available.
95% of our rinse off products
The biodegradability of our rinse-off product portfolio is calculated based on our procured volumes. This means every rinse off product we produce is included in the calculation. Since more products means more ingredients and more impact, we consider this approach to be the most transparent.
95% biodegradable formulas
The biodegradability of our formulas is calculated by aggregating the biodegradability of the individual ingredients in the product. We express a formula’s biodegradability as the percentage (by weight) of biodegradable ingredients relative to the total weight of organic ingredients in the formula.
While an initial assessment has been performed, we are continuing to enhance our understanding of portfolio biodegradability through improvements in data quality, portfolio coverage and assessment methodology. The implementation of a new Product Lifecycle Management (PLM) system tool will further strengthen the accuracy and consistency of our biodegradability assessment, providing a more robust foundation for performance tracking.
We will therefore use 2026 to further strengthen our methodology, data and assessment capabilities. From 2027 onwards, we intend to disclose a biodegradability baseline and report progress against our target using the enhanced assessment approach.
Because 2025 is the first year in which we have established this target, we have developed a Biodegradability Implementation Plan setting out the actions we currently expect may support progress. We will continue to refine this plan and review it periodically to reflect developments in implementation, data quality and coverage, and our evolving understanding of where the greatest improvement opportunities exist.